The playbook
Features
With Bench Metrics, you can...
- Analyze individual players, your team, and your opponents with easy to read reports
- Customize individual, team, and opponent statistics important to your coaching staff, including customizable scoring chances
- Save your stats in a powerful online database that is accessible from laptops, phones, and tablets
- Work with experienced coaches to create an analytics solution that will work for you, regardless of level
- Receive both free unlimited support and training
- Provide logins to as many users as you'd like included in your subscription
- Use our reports to complement existing video software reports, such as XOS, Steva, Sportscode, etc.
- Integrate directly and easily with your existing video software product for quick reporting after the game in seconds
How it works
As hockey coaches ourselves, we know there isn't much downtime. We built this system to make it as simple as possible to enter data and see results fast. You don't have to be an analytics expert, or even a tech guy for that matter, in order to get powerful reports that will change the way you see the game.
Collect data
Data collection can be done during or after the game, using either pen/paper or a laptop. Our system works with both!
Import or enter data into Bench Metrics
Once you have your data, you can easily enter it into our user friendly form or simply import it directly from the video breakdown software of your choice (Steva, XOS, Sportscode, and others supported).
Run reports
We give you over 25 reports with easy ways to filter data. For example, it takes just seconds to run reports for game segments, forward lines or defensive pairings, home vs. road games, and even strength vs. special teams.
See it in the app
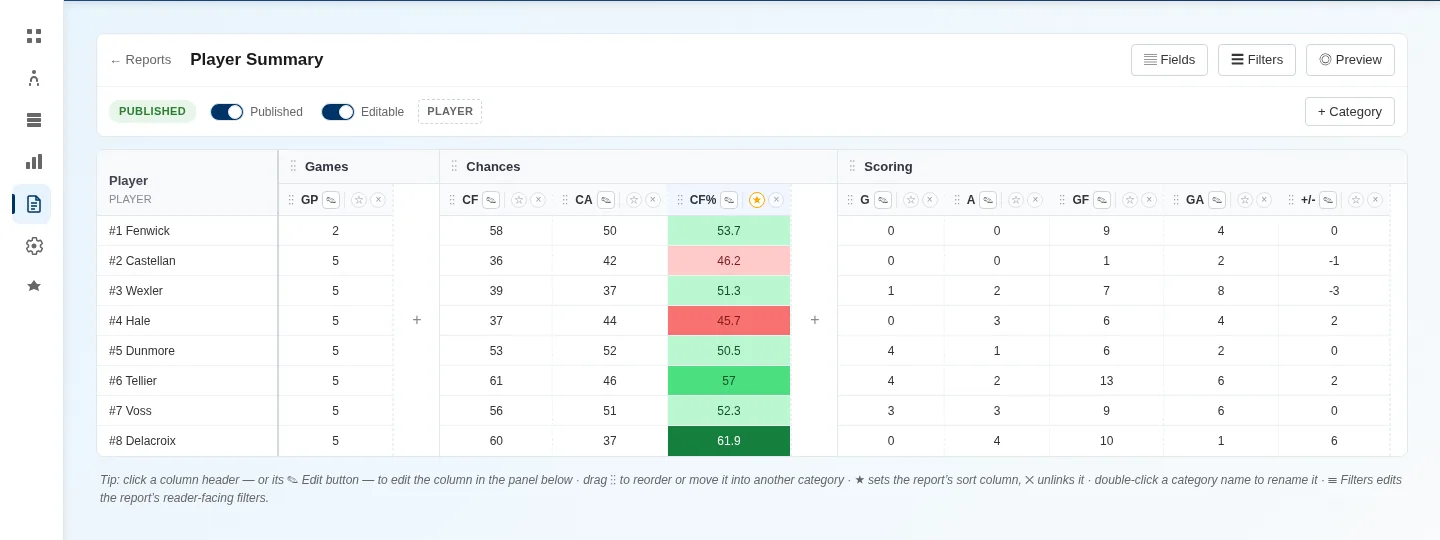
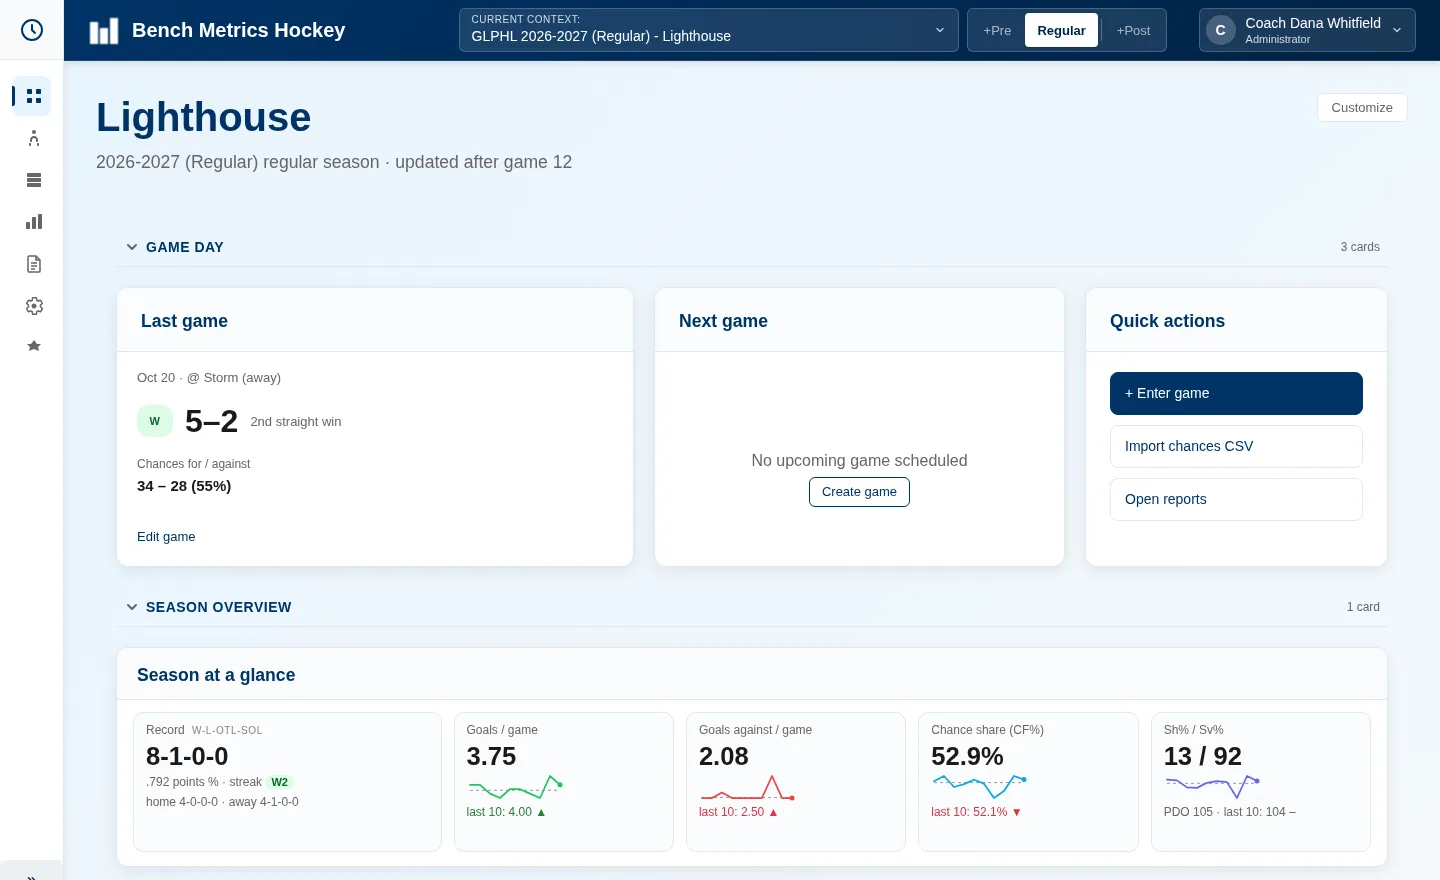
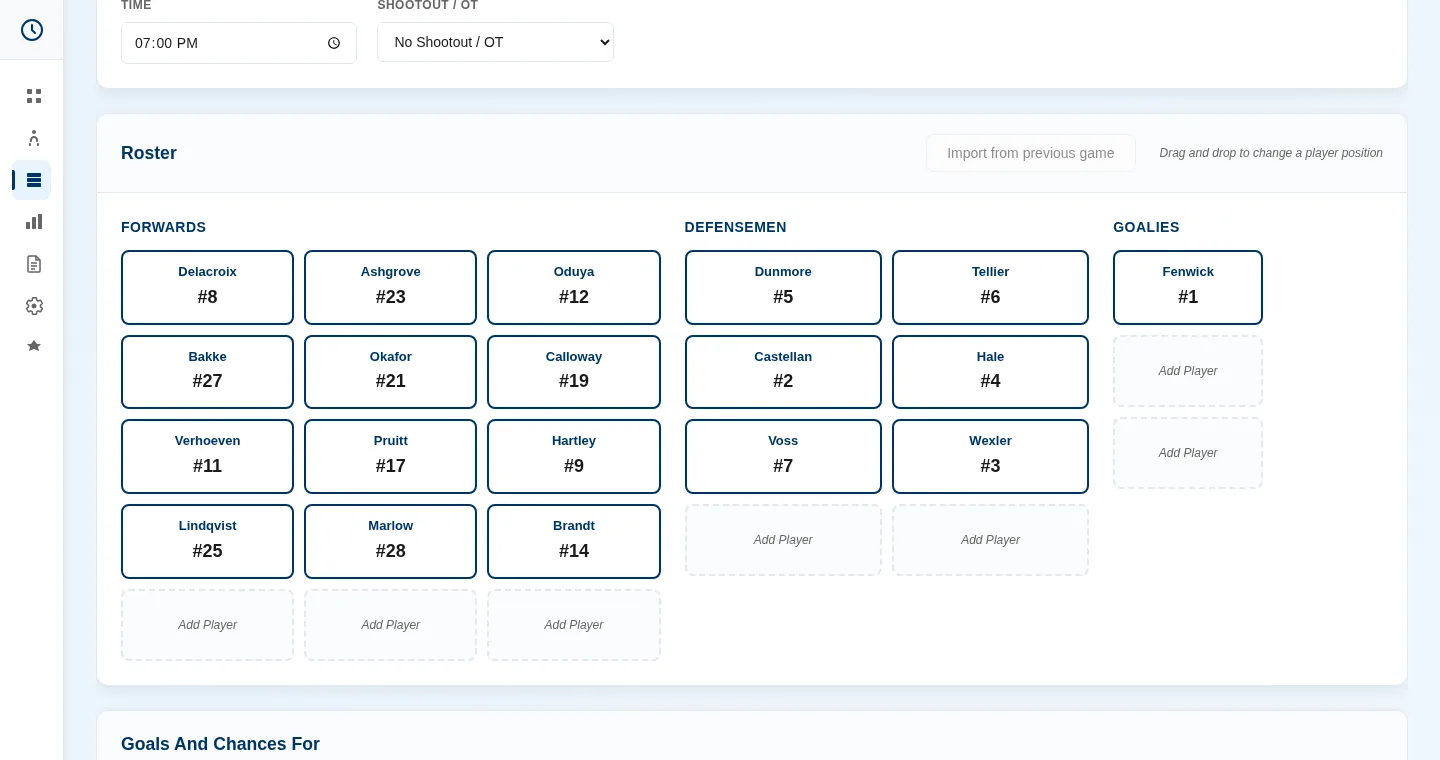
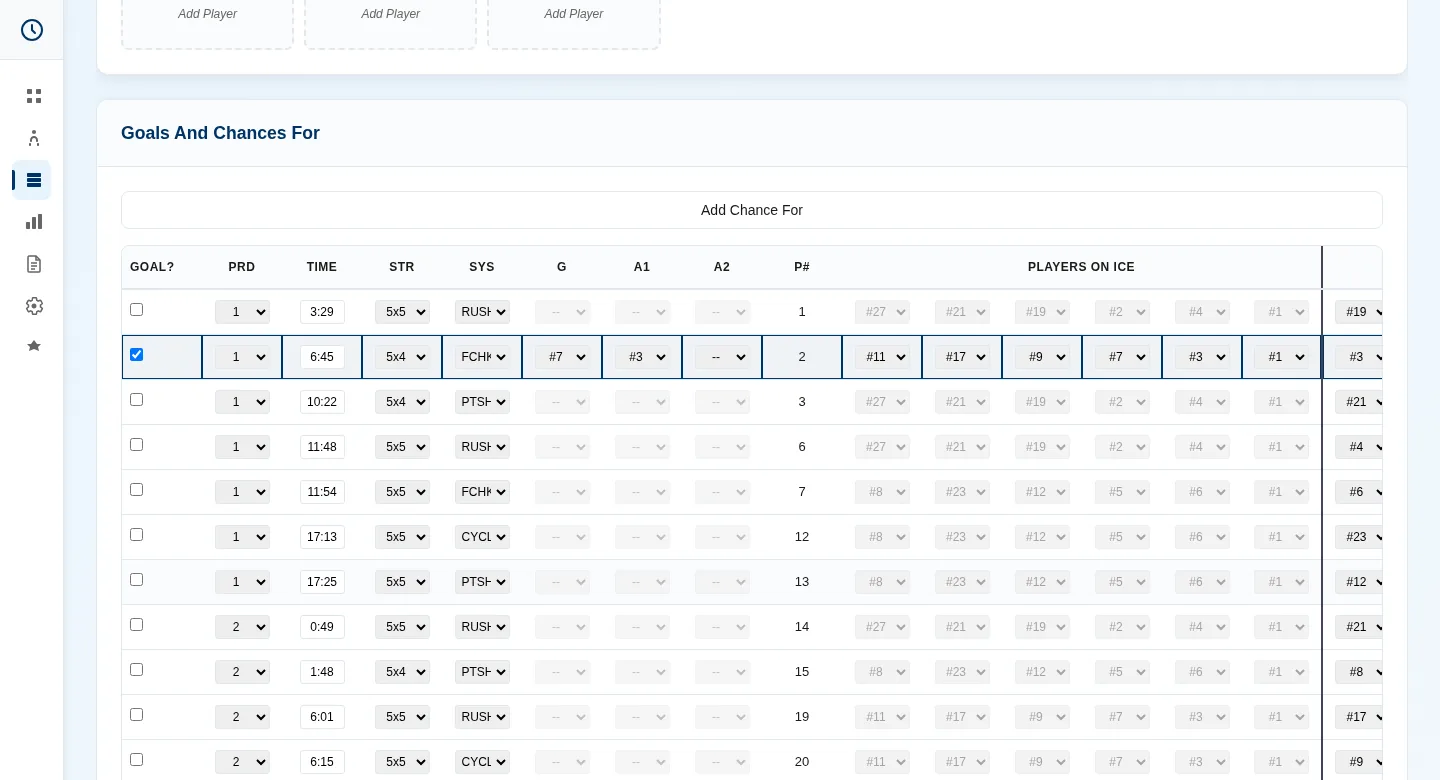
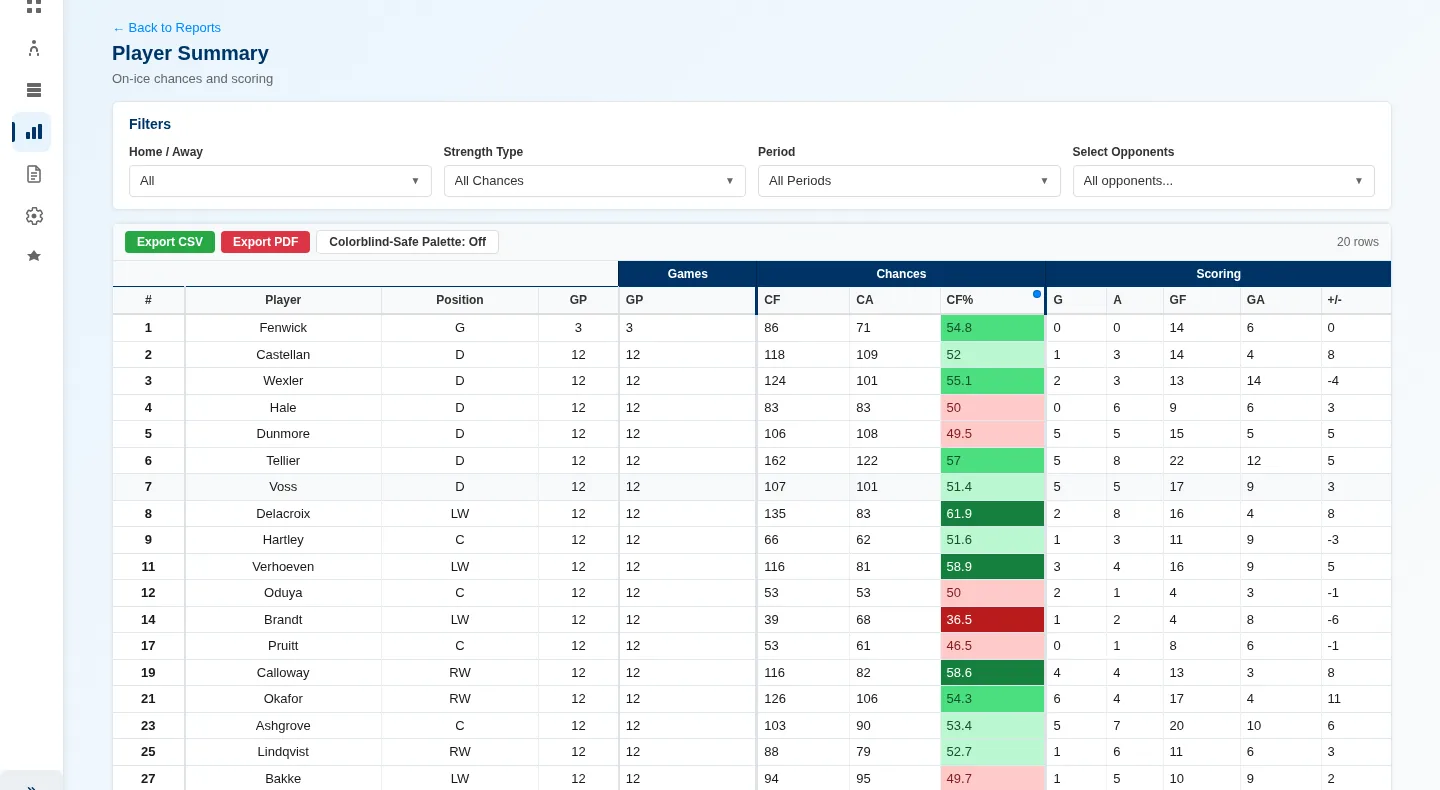
Screens from Bench Metrics, shown with sample data for a fictional team.
Dashboard
Lineup and roster
Enter chances
Color-coded reports
Report builder